What a dependency graph tells you about your code.
A dependency graph draws each part of a codebase as a node and each import as an arrow. Read well, it shows what is risky to change, where the layers leak and what to untangle first. This guide covers how to read one, how it differs from a call graph, and how to generate one for your repository.
What is a dependency graph?
A dependency graph is a directed graph. Each node is a unit of code and each arrow means "depends on": if file A imports file B, there is an arrow from A to B, and a change to B can break A. The units can be functions, files, folders, packages or whole services. The rules for reading it are the same at every scale.
Two different graphs share the name, and they answer different questions.
- A code dependency graph shows the imports between your own files, folders and packages. It answers how the code is structured and what a change will reach.
- A package dependency graph shows the third-party libraries in your manifest and lockfile, and everything they pull in. It answers what you ship and which advisories affect you. GitHub's dependency graph,
npm lsandcargo treework at this level.
This guide is mostly about the first kind, because that is the one that helps you understand and change a codebase.
How to read a dependency graph
A full graph of a real repository has thousands of edges, so nobody reads it edge by edge. You look for a handful of patterns.
Fan-in: who depends on this
Fan-in is the number of arrows pointing into a node. A file with high fan-in, such as a shared error type, a database client or a design-system button, is used all over the codebase. Every change to it ripples outwards, so it deserves a stable interface, good tests and a careful reviewer.
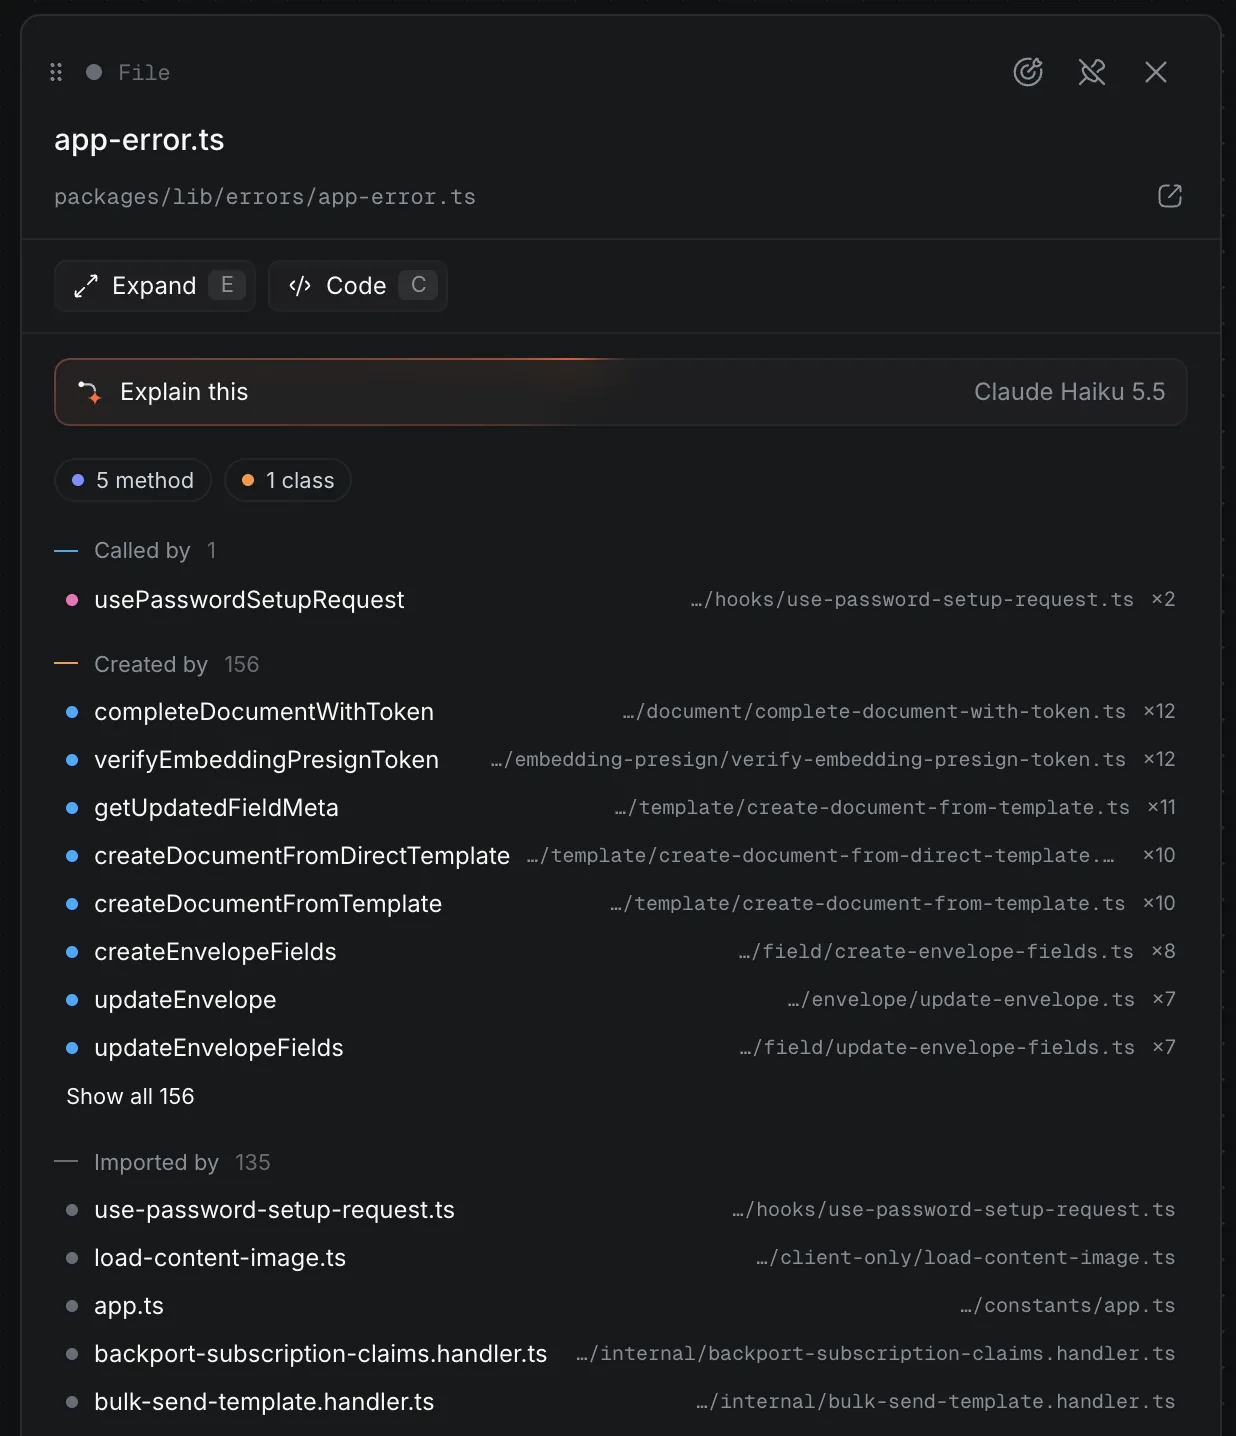
Fan-out: what this depends on
Fan-out is the number of arrows pointing out. A file that imports thirty others is usually an orchestrator: a router, a page, a large service. It is hard to test on its own and it breaks whenever any of its dependencies do. A file with high fan-in and high fan-out at the same time is a hotspot, because it is both fragile and widely used.
Cycles
A cycle is a loop: A imports B, B imports C and C imports A. Every module in a cycle has to be understood, tested and released together, so the loop behaves like one large module with no clear boundary. Some languages refuse cycles outright: Go will not compile an import cycle between packages. Python can fail with a partially initialised module, and JavaScript can hand you a value that has not been initialised yet.
A graph with no cycles is a directed acyclic graph, or DAG. That is the shape to aim for, because a DAG has a clear order: you can build, test and reason about it from the bottom up. To break a cycle, move the shared piece into a new module that both sides import, or invert one of the dependencies so it points the other way.
Layers
Most codebases intend a direction. Routes depend on services, services on the data layer, and everything on shared utilities, never the reverse. Lay the graph out by layer and the arrows should all point one way. An arrow pointing back, such as a utility that imports a route handler, is a layering violation and often the first half of a cycle.
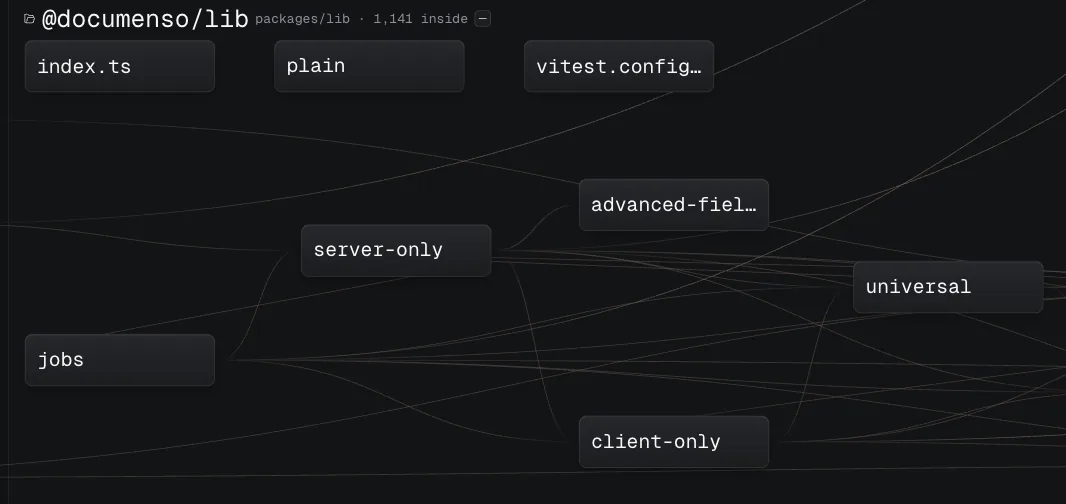
Across the whole lib package, 863 of the 911 imports between folders point left to right. The 48 that point back are where to look. For example, jobs imports server-only 46 times and server-only imports jobs 18 times, so the two folders form a cycle even though no single file does.
Hotspots over time
The graph shows structure, not activity. Combine it with the commit history: a file with high fan-in that also changes every week is where regressions come from. This lists the files changed most often in the last year:
git log --since="1 year ago" --name-only --format="" | sort | uniq -c | sort -rn | head -20Dependency graph vs call graph
A call graph is the same idea one level down. Its nodes are functions and methods, and an arrow means "calls". The two are easy to confuse, but they are built differently and answer different questions.
| Dependency graph | Call graph | |
|---|---|---|
| Nodes | Files, modules, folders or packages | Functions and methods |
| An arrow means | A imports B | A calls B |
| Built from | Import statements, which can be read exactly | Call sites, where callbacks, interfaces and dynamic dispatch make some edges a guess |
| Best for | Architecture, layering, cycles and build order | Following one request, or finding every caller before you change a function |
| Typical tools | madge, dependency-cruiser, pydeps, go list, jdeps | PyCG, pyan, go-callvis, your editor's call hierarchy |
A static call graph is always an approximation. A call through an interface, a callback passed as an argument or a method looked up at runtime cannot always be resolved without running the code. Good tools keep those edges but mark them as possible rather than certain, so you know which arrows to double-check.
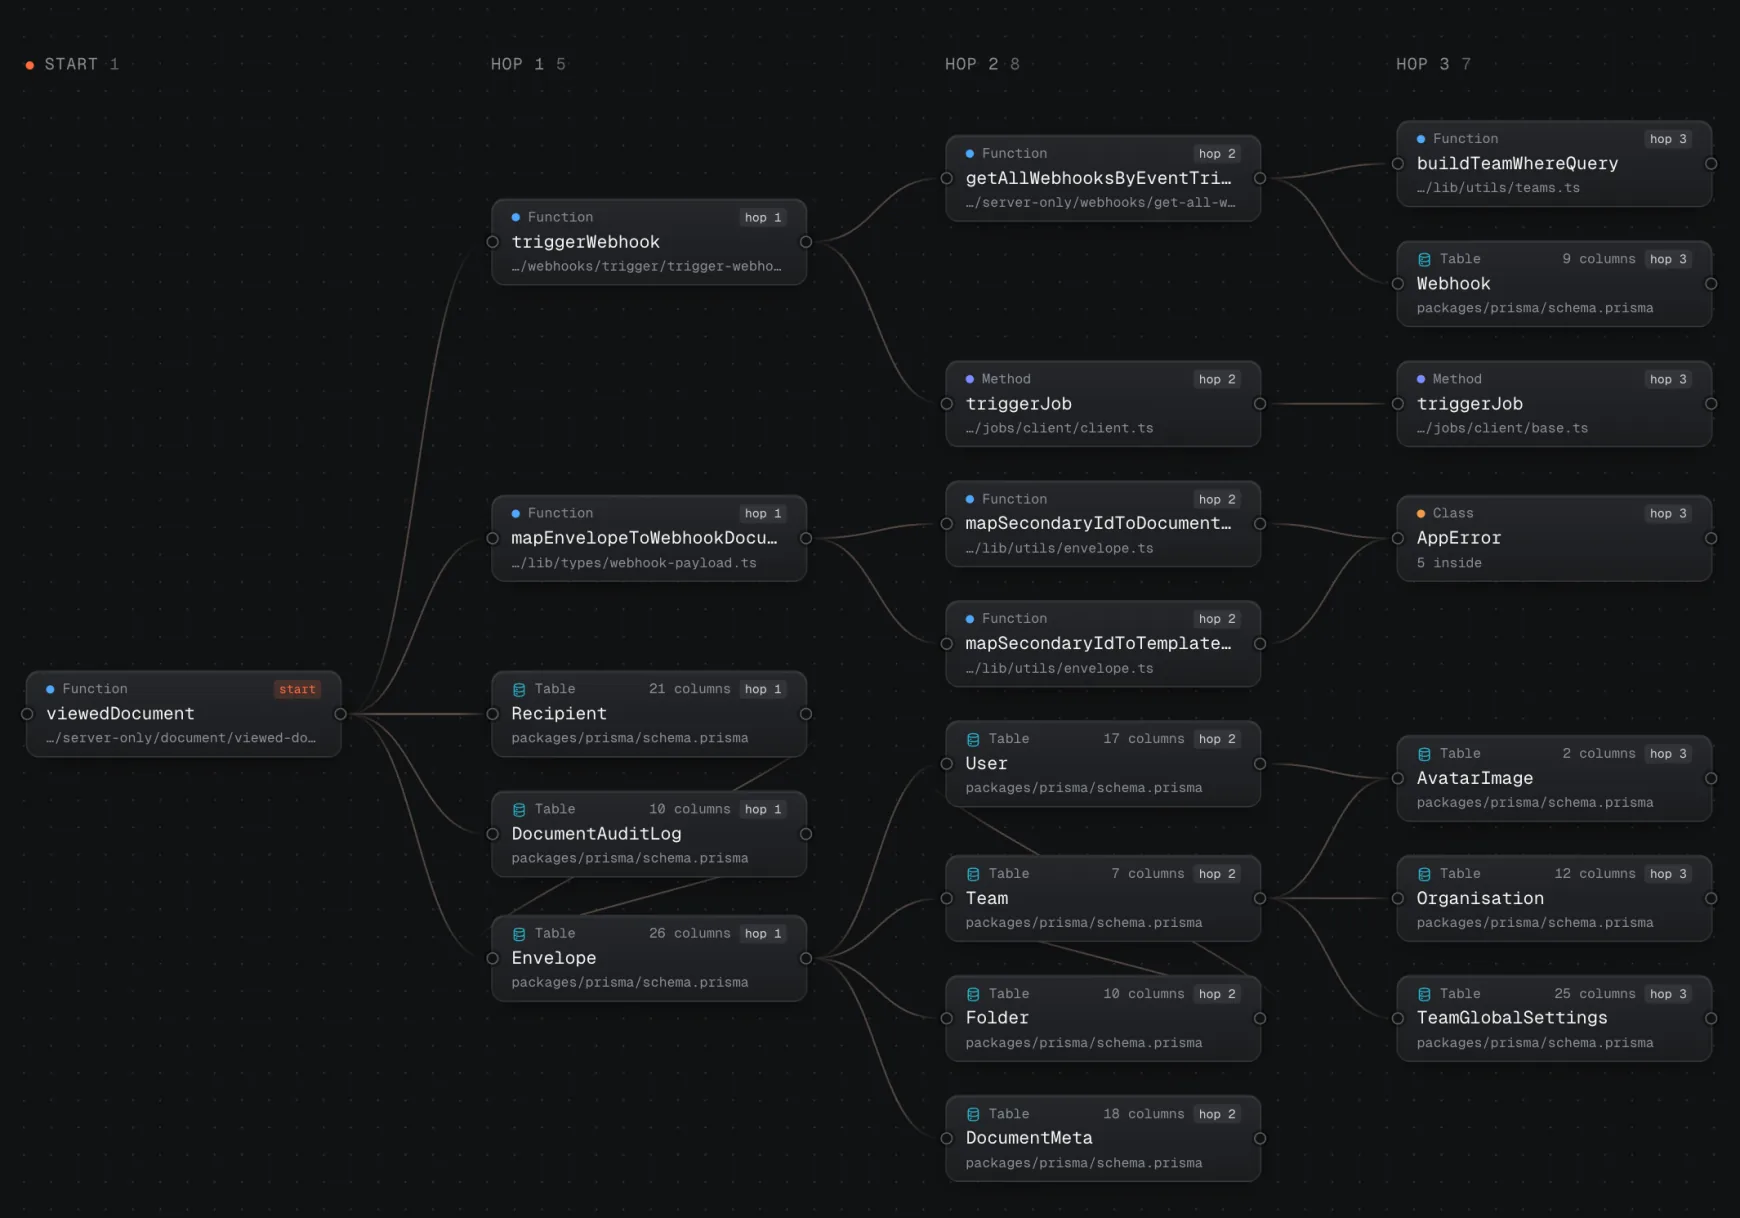
In practice you use both. The dependency graph shows the shape of the system, and the call graph follows one path through it.
How to generate a dependency graph
Most ecosystems have a command-line tool that walks the imports and prints the graph, or renders it with Graphviz. These are the common ones.
JavaScript and TypeScript
madge draws the graph and lists cycles. dependency-cruiser does the same and also lets you write rules, such as "nothing in lib may import from routes", and fail the build when one is broken.
npx madge --extensions ts,tsx --image graph.svg src/
npx madge --extensions ts,tsx --circular src/
npx depcruise src --include-only "^src" --output-type dot | dot -T svg > graph.svg
Python
pydeps renders the imports of a package as an SVG. For function-level call graphs, PyCG and pyan are the usual choices.
pydeps yourpackageGo, Rust and Java
Go has the data built in. go list prints each package with its imports, while go mod graph shows module requirements, which is the package-level kind. For Rust, cargo tree shows crate dependencies and cargo tree -i inverts it to show who depends on a crate. For Java, jdeps ships with the JDK and can write Graphviz files.
go list -f '{{.ImportPath}}: {{join .Imports " "}}' ./...
cargo tree -i serde
jdeps --dot-output deps target/app.jar
Where these tools stop
- Each covers one language, so a TypeScript front end and a Python service end up on two separate graphs.
- They draw everything at once. Past a few hundred files the picture becomes a hairball you cannot read.
- The output is a static image. You cannot ask it what imports a given file or follow an edge to the code.
- They stop at imports. Routes, database tables and the calls between functions are not on the picture.
A dependency graph you can explore
Nodeway is a desktop app, free for now, that builds this graph for a whole repository on your own computer. Open a folder and it maps files, functions, components, routes and database tables in eleven languages onto one map, with the imports and calls between them. Nothing is uploaded.
- Packages first, details on demand. The map opens at the level of packages and folders. Expand only the part you are working on, so a large repository does not turn into a hairball.
- Fan-in and fan-out for any node. Select a file to see what it imports and everything that imports it, with counts.
- The call graph on the same map. Trace forward or back from any function, hop by hop, down to the tables it reads and writes.
- Impact of a change. Show impact lights up what your branch changes and everything that depends on it within a few hops: routes, components, tables and tests.
Not yet in Nodeway
There is no list of import cycles yet. For a cycle check in CI, use madge --circular or a dependency-cruiser rule alongside it.
You can try it in the browser on Documenso's code with the live demo. If you are new to a codebase, the guide on how to understand a large codebase shows where a map fits into the first week.